 If you just want the result spreadsheet, Here it is
If you just want the result spreadsheet, Here it is
 After I Built my wood strength tester,
two fellow YouTubers offered to send me some samples of different wood species.
These ones are from
Peter Collin, already cut to size.
After I Built my wood strength tester,
two fellow YouTubers offered to send me some samples of different wood species.
These ones are from
Peter Collin, already cut to size.
 John from FarmCraft 101
sent me these samples. Jon wasn't aware of the high cost of postage to Canada, so he just
sent some bigger pieces to cut samples out of. Postabe was over $100 USD.
John from FarmCraft 101
sent me these samples. Jon wasn't aware of the high cost of postage to Canada, so he just
sent some bigger pieces to cut samples out of. Postabe was over $100 USD.
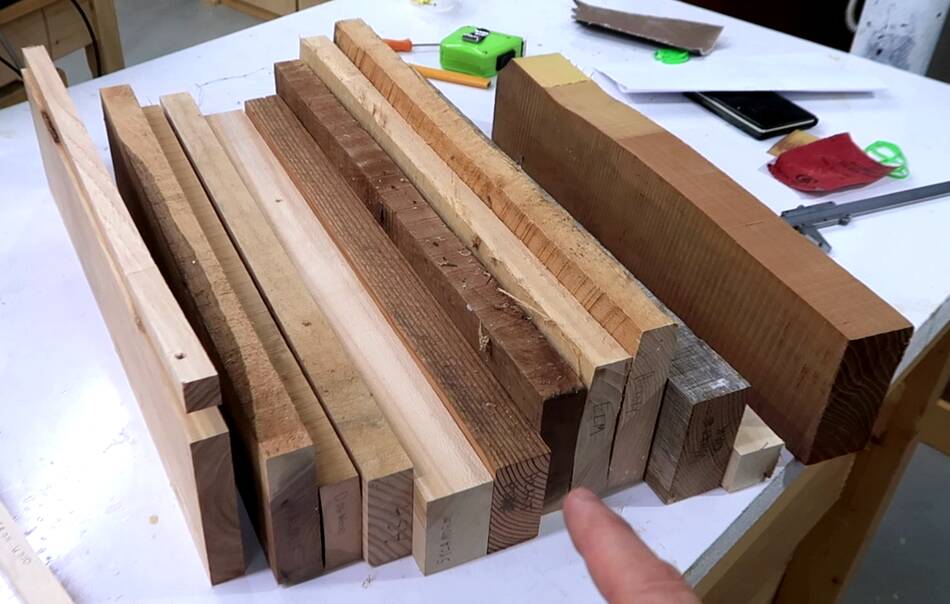
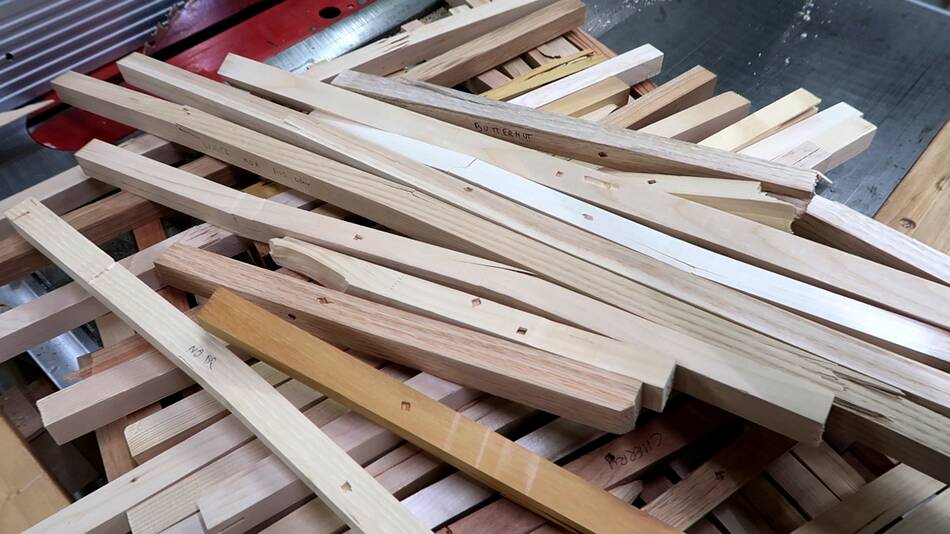
 I also had some samples of my own to prepare. I used to have a better selection of different woods,
but foolishly I didn't bring my wood stash with me on the last move in 2018.
I also had some samples of my own to prepare. I used to have a better selection of different woods,
but foolishly I didn't bring my wood stash with me on the last move in 2018.
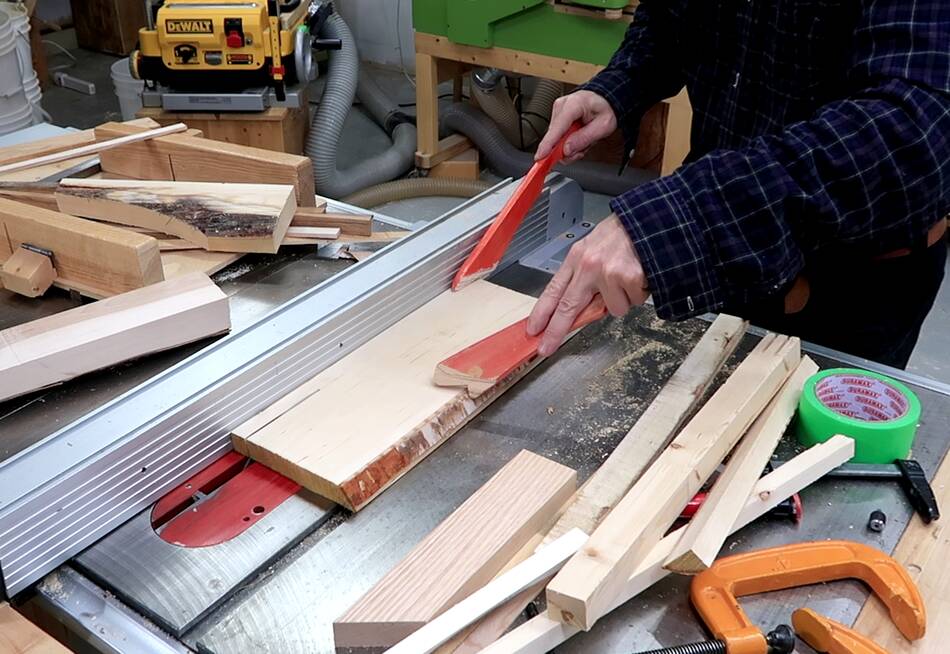
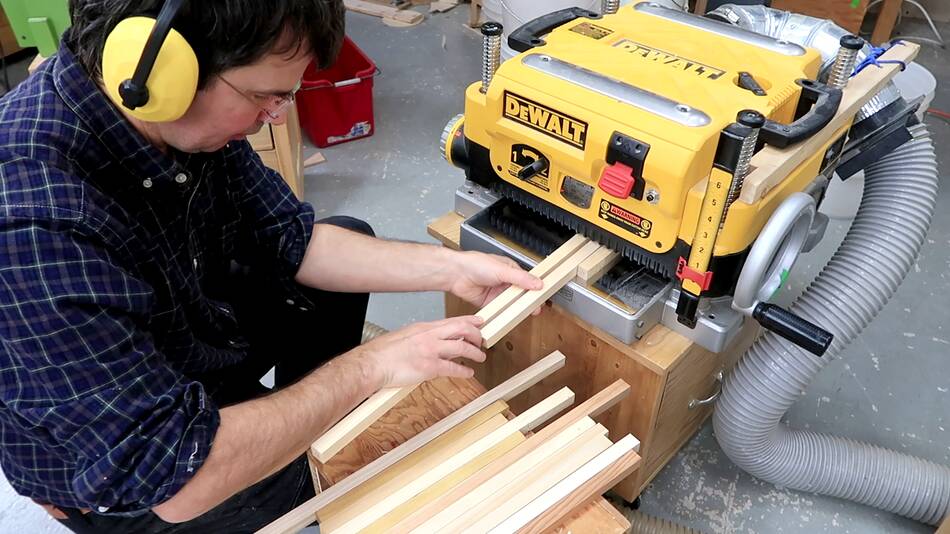 I planed all the pieces down to 17x17 mm. Peter's pieces were actually 20x20 mm, which would
have been better for testing with, but the stepper motor driven screw jack in my machine will
only exert about 250 Kg reliably, or 550 lbs. 17x17 mm was about as large as I could go and
still break the pieces.
I planed all the pieces down to 17x17 mm. Peter's pieces were actually 20x20 mm, which would
have been better for testing with, but the stepper motor driven screw jack in my machine will
only exert about 250 Kg reliably, or 550 lbs. 17x17 mm was about as large as I could go and
still break the pieces.
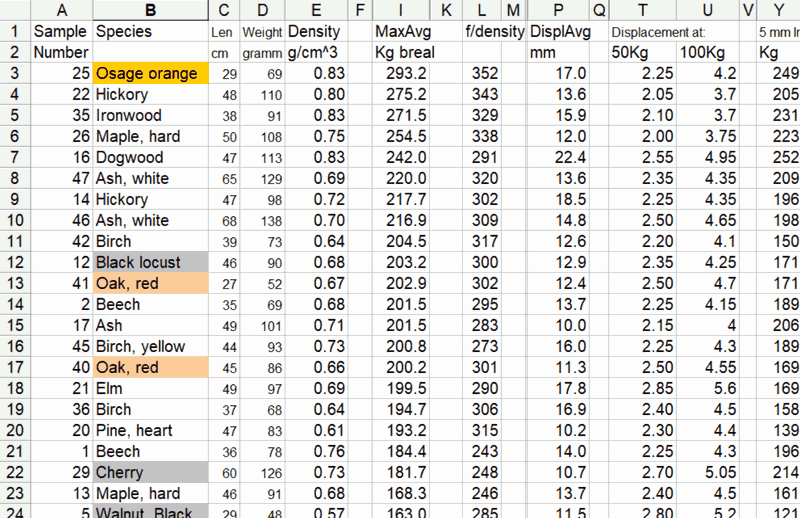
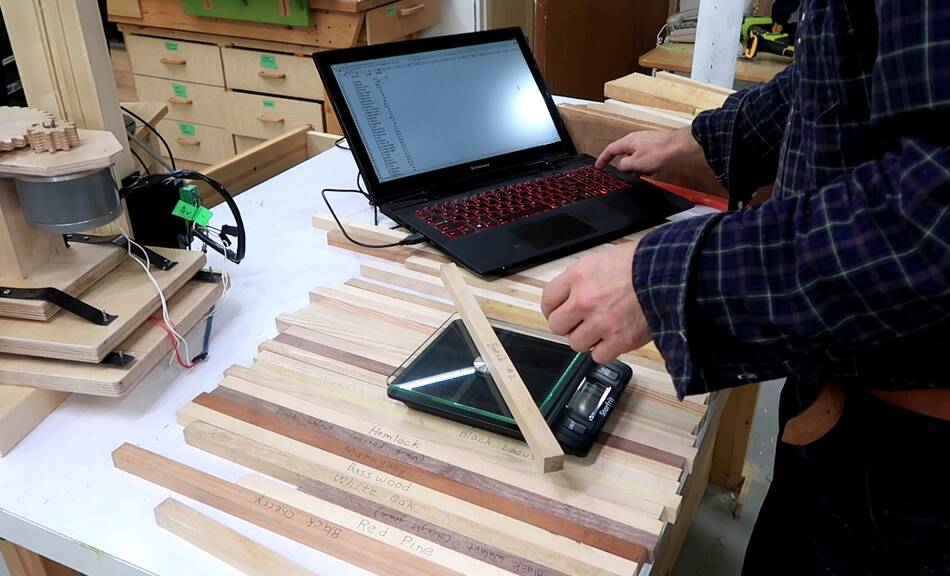 After that I measured the length of each test piece, then weighed them all. From that I worked
out the density relative to water for each piece.
After that I measured the length of each test piece, then weighed them all. From that I worked
out the density relative to water for each piece.
My denesst sampls were Osage orange (0.93), Ironwood (0.93), Dogwood (0.83), Hickory (0.80), Beech (0.76), and Hard maple (0.75).
The least dense samples were Cedar (0.31, 0.36), Pine (0.33), spruce (0.33) and Basswod (0.37).
These were all for individual samples. There is considerable variation in density between pieces of wood of the same species.
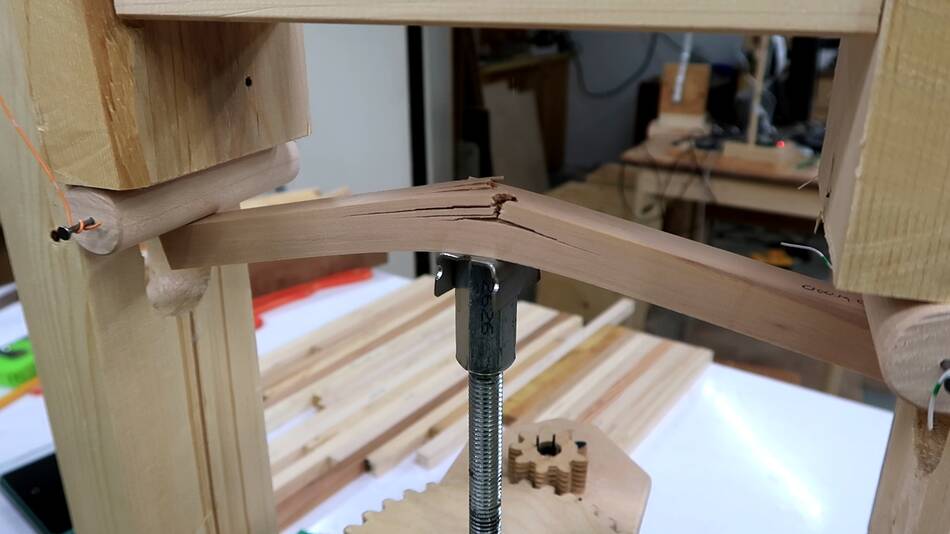
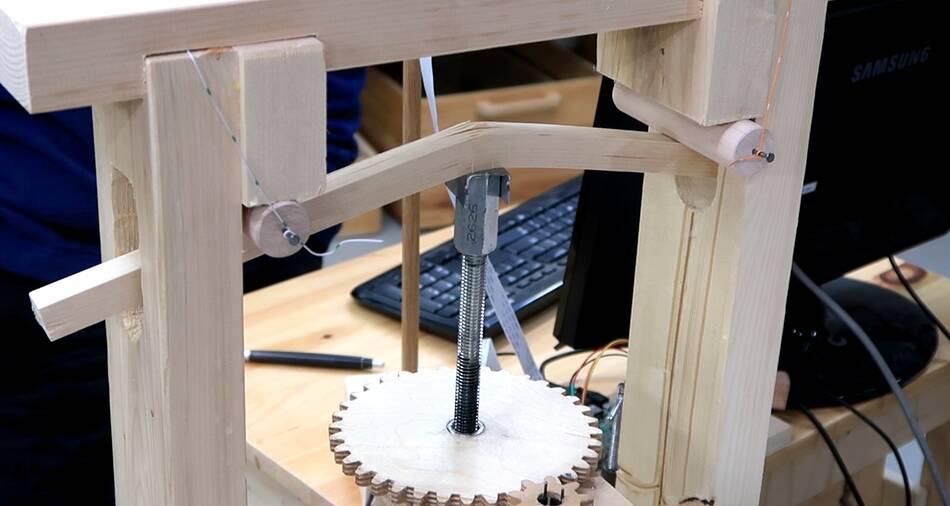
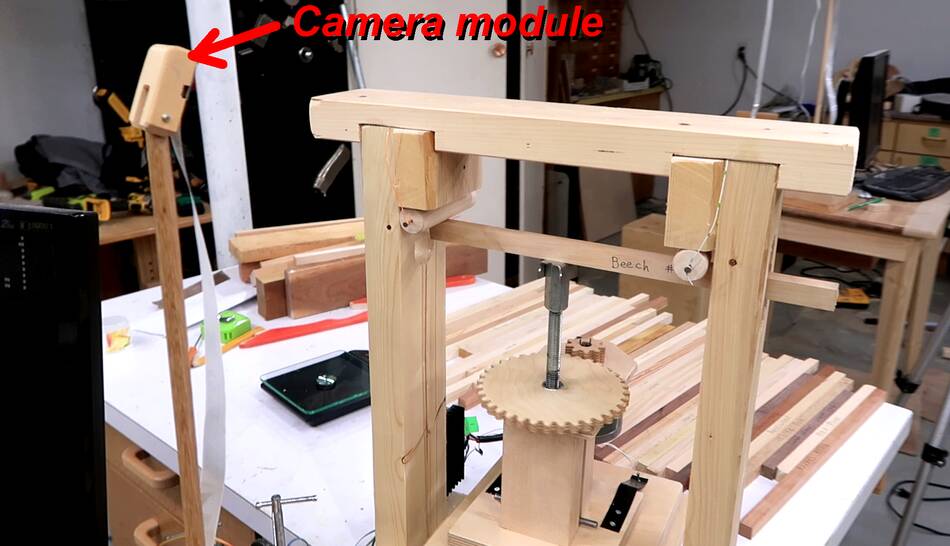 Test piece loaded into my tester. The screw jack pushes up in the middle and the test piece is
held down by the round pieces on either side. These are 24.5 cm apart, center to center.
Test piece loaded into my tester. The screw jack pushes up in the middle and the test piece is
held down by the round pieces on either side. These are 24.5 cm apart, center to center.
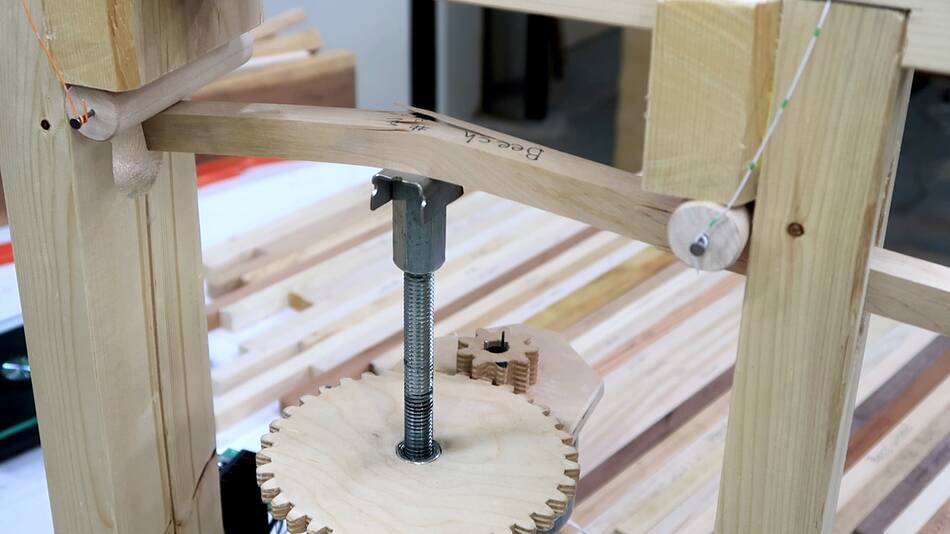
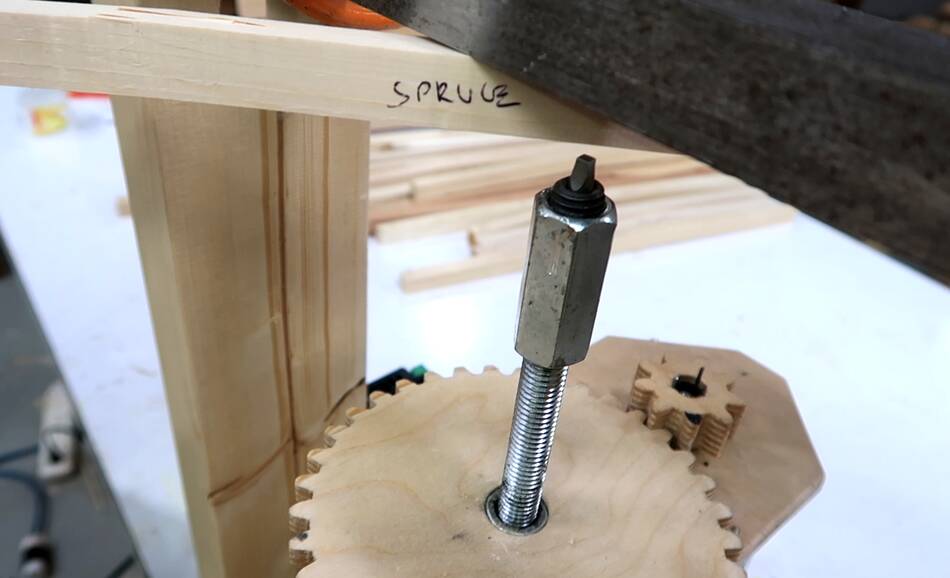
The large gear is turned clockwise by a stepper motor with a small gear on it behind it. This threads the nut downward. The nut pushes against a bearing below it, pushing the threaded rod up.
The screw jack sits on a platform with four bathroom scale load cells to measure the force. It's tared with the screw press already on it, so there's no need to adjust for the weight of the jack and stepper motor, which are also supported by the load cells. I made a video about this testing machine
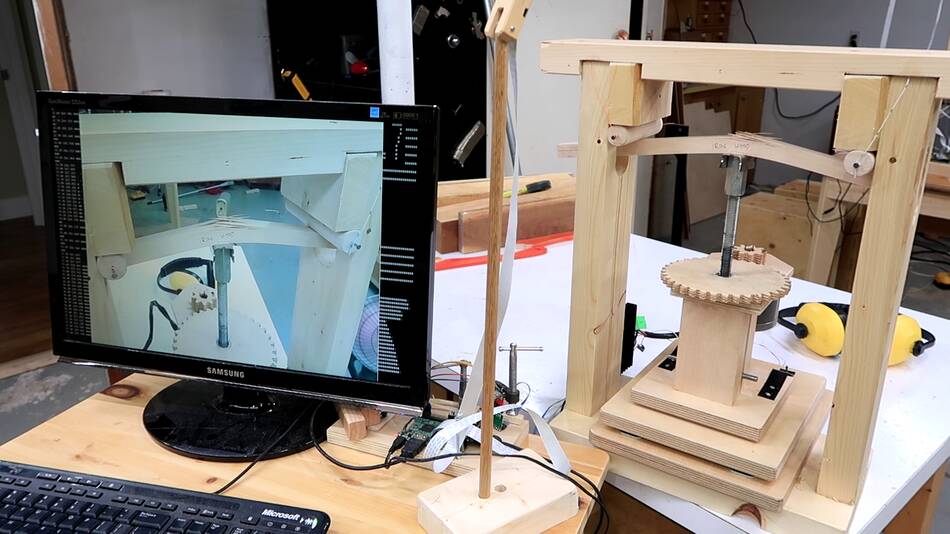
A camera module in front of the setup takes a picture at the start of every test and another after the piece has failed.
 A python script running on a Raspberry Pi 3 runs everything. A line is printed with each 0.1 mm
increment in jack displacement, showing the force in Kg, plus a line of '#' symbols to graph
the current force. a '+' is also drawn to show the change in force from one reading to the next.
The current force, in Kg, is also shown large at the top right.
A python script running on a Raspberry Pi 3 runs everything. A line is printed with each 0.1 mm
increment in jack displacement, showing the force in Kg, plus a line of '#' symbols to graph
the current force. a '+' is also drawn to show the change in force from one reading to the next.
The current force, in Kg, is also shown large at the top right.
 Because the apparatus is fairly stiff and applies displacement instead of force, once the wood
starts to fail, it typically doesn't snap all the way. A partial crack is enough for the wood
to bend more and relieve some of the force. Once my program sees a 10% drop in force from peak,
it deems the test piece to have already reached it's ultimate breaking force, even if it hasn't
actually broken apart. From previous experiments, I knew that large a drop in force was
the end, and continuing to push further would not cause an increase in force above the previous peak.
Because the apparatus is fairly stiff and applies displacement instead of force, once the wood
starts to fail, it typically doesn't snap all the way. A partial crack is enough for the wood
to bend more and relieve some of the force. Once my program sees a 10% drop in force from peak,
it deems the test piece to have already reached it's ultimate breaking force, even if it hasn't
actually broken apart. From previous experiments, I knew that large a drop in force was
the end, and continuing to push further would not cause an increase in force above the previous peak.
Most hardwoods failed by fibers starting to tear on the tension side, though well before this, the force graph showed that the wood itself was starting to yield as the amount of additional force for each additional 0.1 mm of displacement went down. For elastic deformation, force should linearly increase with displacement.
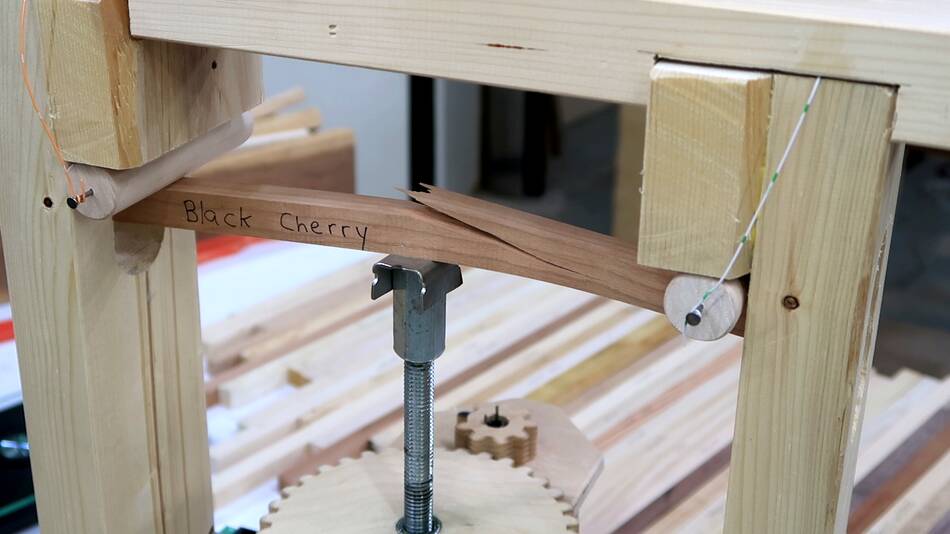 But some woods just snapped.
 Once I got into a routine, each test took about 1.5 minutes. Most test pieces were long enogh that
I could break it in two places and get more data points. Harriet (6 years old) came down to watch for
a while, but she found it pretty boring. I took the opportunity to listen to podcasts
while running tests. This apparatus is a big improvement over watching the numbers on a
bathroom scale, which is how I had previously tested
Once I got into a routine, each test took about 1.5 minutes. Most test pieces were long enogh that
I could break it in two places and get more data points. Harriet (6 years old) came down to watch for
a while, but she found it pretty boring. I took the opportunity to listen to podcasts
while running tests. This apparatus is a big improvement over watching the numbers on a
bathroom scale, which is how I had previously tested
I started with 42 test pieces, but made a few more using woods I had lying around, so I had over 50. At two breaks each piece, it was about 100 breaks.
 This one is "dogwood", sent to me by Peter Collin. I hadn't heard about dogwood before,
but its a very heavy, hard and resiliant wood!
This one is "dogwood", sent to me by Peter Collin. I hadn't heard about dogwood before,
but its a very heavy, hard and resiliant wood!
 Some of the spruce pieces just snapped half instead of failing gradually.
Though it's more spectacular, I preferred that samples stay attached to each other after a
test. Less messy and easier to keep track of.
Some of the spruce pieces just snapped half instead of failing gradually.
Though it's more spectacular, I preferred that samples stay attached to each other after a
test. Less messy and easier to keep track of.
 This is the computer taking the "final" picture, after it has deemed the piece to have failed
because the force dropped by more than 10% from peak.
This is the computer taking the "final" picture, after it has deemed the piece to have failed
because the force dropped by more than 10% from peak.
The highest maximum loads were for Osage Orange (293 Kg), Hickory (275 Kg). Ironwood (271 Kg),
hard Maple (254 Kg), Dogwood (242 Kg), White Ash (200 Kg).
The dogwood sample had it's maximum force at 22 mm of deflection, whereas the strongest hard maple failed at jsut 12 mm deflection. This combination of large deflection and large force means it took more energy to break the dogwood. So dogwood would make an excellent wooden spring, such as for making a bow. I figured for a bow, you want wood that is strong, flexes lots, and is light. So I added a column to my spreadsheet of numbers multiplying maximum force, deflection and maximum force, divided by density. The dogwood was the winner by that criteria, followed by Osag Orange.
 Then again, looking at the yield curves, dogwood may have started plastic deformation
at around 80 Kg load, whereas Osag Orange's plastic deformation probably started arund 150 Kg.
So Osage Orange may be a better lasting bow. Repeated stressing to the point of plastic deformation
alters the wood, which is an aspect I didn't test. But both Dogwood and Osage orange failed suddenly
and with a bang, as opposed to gradually starting to splinter with Hickory. I think a more gradual
failure like with Hickory would be more desirable. It would be interesting to take typical bow
wood samples and design a test procedure to specifically test the wood's ability to store
and recover energy as a spring, with repeated cycling.
Then again, looking at the yield curves, dogwood may have started plastic deformation
at around 80 Kg load, whereas Osag Orange's plastic deformation probably started arund 150 Kg.
So Osage Orange may be a better lasting bow. Repeated stressing to the point of plastic deformation
alters the wood, which is an aspect I didn't test. But both Dogwood and Osage orange failed suddenly
and with a bang, as opposed to gradually starting to splinter with Hickory. I think a more gradual
failure like with Hickory would be more desirable. It would be interesting to take typical bow
wood samples and design a test procedure to specifically test the wood's ability to store
and recover energy as a spring, with repeated cycling.
White ash also did relatively well on that score. It's no wonder my dad always used white ash for axe handles. Hickory is even better for axe handles, but there weren't any hickory trees where we lived.
 Interestingly, all the dark woods seemed to fail with a bang, either snapping, or
having a large part of the wood fail at once, while most of the lighter colored hardwoods
failed more gradually.
Interestingly, all the dark woods seemed to fail with a bang, either snapping, or
having a large part of the wood fail at once, while most of the lighter colored hardwoods
failed more gradually.
I think this sudden snapping is an undesirable quality for chairs. you don't want a chair to break from being knocked over by a kid, so I wouldn't recommend any dark woods for chairs.
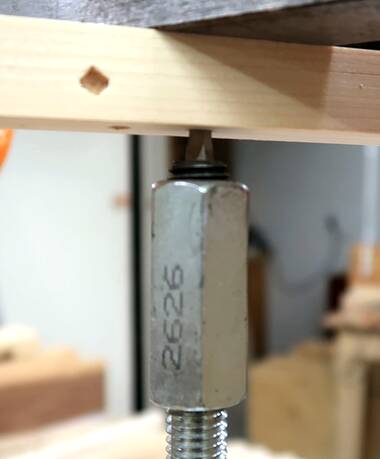 After that I switched my apparatus to have a stiff iron bar instead of the workpiece,
and mounted a #3 robertson screwdriver bit on top of my screw jack. A #3 bit is 3/16" or 4.76
mm square. I changed the software to raise the jack until it hit 2 Kg of resistance, then push
a further 5 mm and measure the force required as a measure of hardness. I didn't compensate
for flex in my apparatus, so the identation depth on the hardest woods, with a quarter ton of force,
might have been as low as 3 mm. But it's a relative measure anyway.
After that I switched my apparatus to have a stiff iron bar instead of the workpiece,
and mounted a #3 robertson screwdriver bit on top of my screw jack. A #3 bit is 3/16" or 4.76
mm square. I changed the software to raise the jack until it hit 2 Kg of resistance, then push
a further 5 mm and measure the force required as a measure of hardness. I didn't compensate
for flex in my apparatus, so the identation depth on the hardest woods, with a quarter ton of force,
might have been as low as 3 mm. But it's a relative measure anyway.
The common hardness criteria, the "Janka hardness test" involves measuring the force needed to push a 0.444" (11.3) mm steel ball half way into a piece of wood. But this would require bigger test pieces and over a ton of force for the harder woods.
 I pressed two divots on each workpiece, on different sides.
As expected, the heavier woods scored much better on this than lighter woods. Top samples
were Dogwood (252 Kg), Osag Orange (249 Kg), Ironwood (231 Kg), hard Maple (223 Kg), Cherry (214 Kg),
and white ash (209 Kg, 206 Kg), Hickory (196 Kg), and Beech (189 Kg).
I pressed two divots on each workpiece, on different sides.
As expected, the heavier woods scored much better on this than lighter woods. Top samples
were Dogwood (252 Kg), Osag Orange (249 Kg), Ironwood (231 Kg), hard Maple (223 Kg), Cherry (214 Kg),
and white ash (209 Kg, 206 Kg), Hickory (196 Kg), and Beech (189 Kg).
Softest were Cedar (45 Kg), Pine (47 Kg), Spruce (55 Kg), Basswod (56 Kg)
With only a few samples, I can't say that this 100% representative of the species, but it confirmed my gut feel
This score is useful for tables. The more it takes to push a divot int the wood, the less dinged up a table, floor, or any other furniture will get over time.
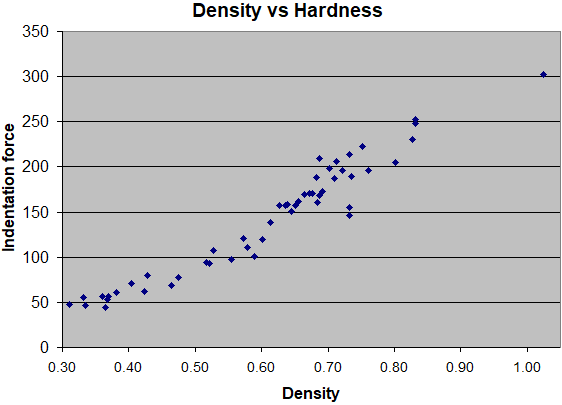 After I published this article and video, I had the idea of doing an XY scatter plot
of wood density vs. hardness that I tested. It turns out, my tested hardness correlates
really well with force required to indent the wood, to the point that you could just
use weight as an indicator of hardness.
After I published this article and video, I had the idea of doing an XY scatter plot
of wood density vs. hardness that I tested. It turns out, my tested hardness correlates
really well with force required to indent the wood, to the point that you could just
use weight as an indicator of hardness.
The two outliers towards the bottom right, just straddling the 150 Kg line are white oak, the outlier on the opposite side, towards the top left, is white ash. So white ash, while it's a bit lighter than the white oak I had, is considerably harder.
The outlier towards the top right is wood from a lilac bush, from a sample sent to me a month after I ran the other tests. Lilac is a very dense and hard wood, will sink in water even after drying. But it's not a practical species to use for most things because it's from a bush, not a tree, so there are no long, wide or straight pieces to be had. The grain on my lilac samples wasn't all straight, causing it to break prematurely.
I thought about and played around with different methods of testing the cross grain strength, and the one I settled on was to push a wedge into a small notch cut into the wood and measure how much force that took to split the wood.
This method didn't require much wood, so that I could cut multiple test pieces off the ends of my bend strength specimens. For some of the specimens, I really didn't have much wood to play with.
I cut the end of the threaded rod into a wedge shape with a sharp point and polished sides in the hope that friction with the wood would not be a big factor. But it turned out, a flat spot developed on the end of my splitting point from the threaded rod repeatedly ramming into the horizontal steel bar. This ramming happened because for the stronger pieces of wood, with spontaneous failure, the sudden release of tension caused my screw jack to jump up, sometimes far enough to hit the steel bar!
A flat spot on the end of the wedge could cause an increase in the force necessary if the flat spot bottomed out in the notch I cut, as it require crushing a small amount of end grain wood to proceed with the split. This added some experimental error, though I still found the results useful and interesting.
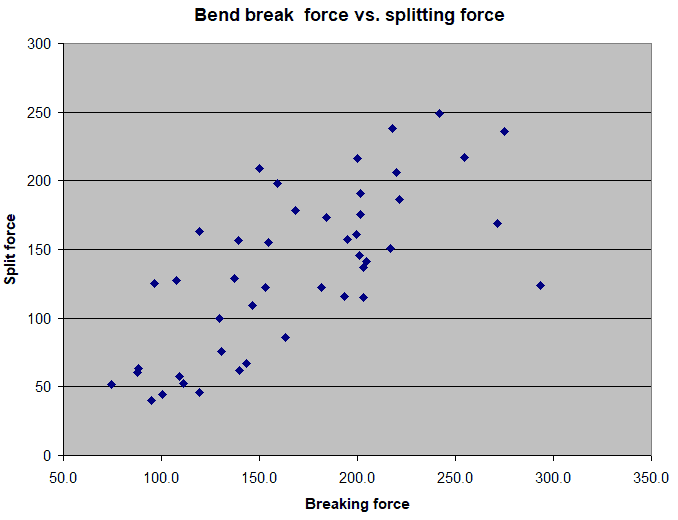
To me, the most interesting result was when I started making scatter plots, one
point for each test sample.
At left, bending breaking force (strength along the grain) vs. splitting force (strength across the grain). Though the stronger woods tend to have higher splitting forces, the correlation is not that tight.
Which is to say, strength along the grain is not a good predictor of strength across the grain.
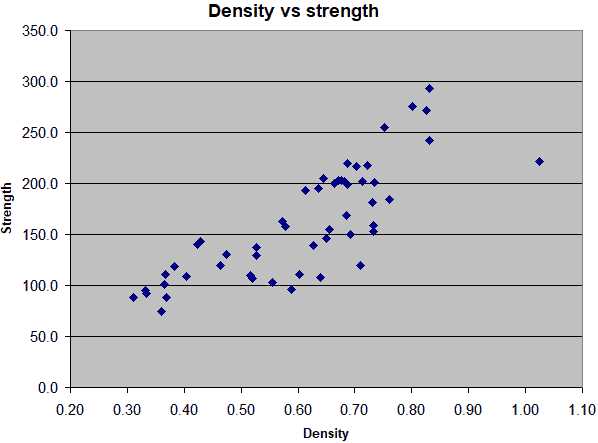 I had previously plotted the density of the wood vs. break strength.
Denser woods are stronger, as expected.
I had previously plotted the density of the wood vs. break strength.
Denser woods are stronger, as expected.
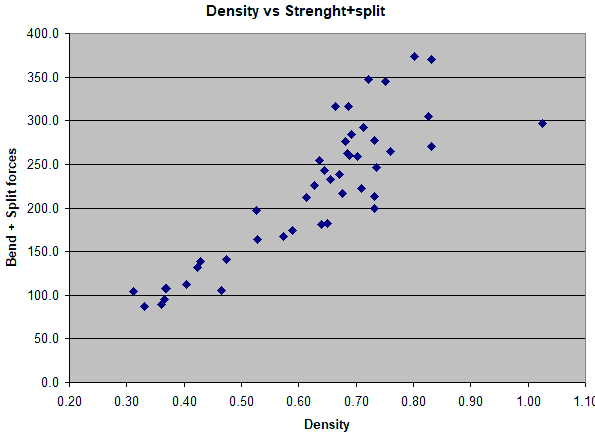 But when I plotted the sum of the breaking force plus half the splitting force against
density, the samples fell on much more of a line. It correlates really well.
But when I plotted the sum of the breaking force plus half the splitting force against
density, the samples fell on much more of a line. It correlates really well.
So making wood stronger along the grain requires more density. Making wood stronger across the grain against splitting also adds density. Adding the two forces together makes a good prediction of the wood density. Considering variability and experimental error, I'm surprised this plot forms such a narrow pattern.
If you want to play around with the results spreadsheet yourself,
click here to download it
 Testing different wood joint types
 Shelf brackets: Double tenons vs. screwed vs pocket holes
 Which glue is strongest? Glue tests
 Construction adhesive as woodworking glue
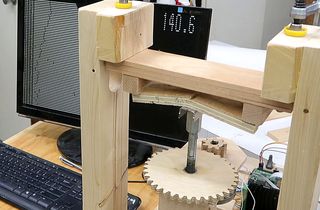 How strong is plywood, MDF, ODB and particle board
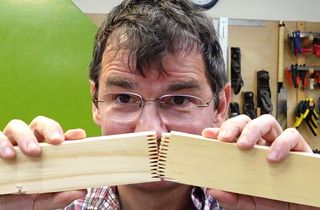 How strong is finger jointed lumber